Reporter Professional Plus Version 5.x
Reporter Professional Plus is our class defining energy logger data analysis and tariff comparison software and replaces our older products, such as "Reporter Pro" and "Hawk Commander". Celebrating nearly 30 years of reducing waste and saving money, with the first "Hawk Reporter" DOS edition released in 1987. This eventually became "Reporter Pro" (for Windows) and we have now standardised on the "Plus" edition, which supports more loggers and includes many additional features.
- Instant professional looking reports
- Produce multiple reports with a single click
- Compare circuits, history and different files
- Automatic breakdown of recorded data by time band
- Detailed tariff analysis, enabling accurate cost comparison
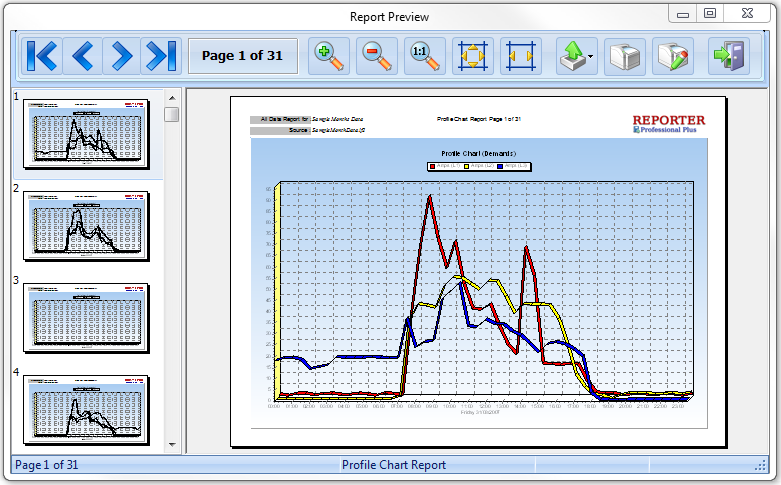
- Profile charts are colour coded by time band
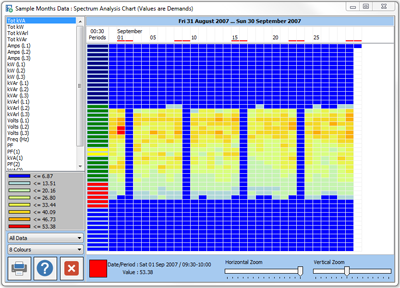
- Whole survey spectrum analysis
- Supports Hawk I, Hawk II, Hawk 3000, Hawk 5000, Profile, eTracker + more
- Easy to use, with a simple button based menu system
- Import from different data sources
- Much quicker, easier and better looking than using a spreadsheet!
- Compatible with the latest Windows versions
- "Plus" version is now included as Standard (more loggers supported)
- Support included for Sinergy Meters e-Tracker
- Updated User Interface
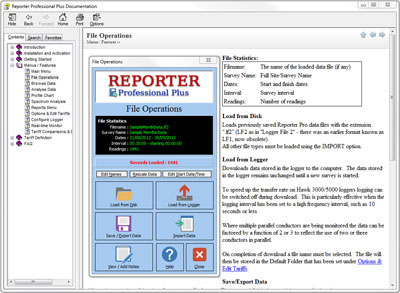
- Fully integrated Help and Manual
- Option to use Unified Colours
- Improved logger communication selection
- Single PDF Auto Reports (multiple reports in single PDF for emailing)
- PDF chart reports (example: chart per day into single PDF)
- New graphical real-time monitor
- Even better chart quality
Compatible with Windows 8 and 10 (32-bit & 64-bit) New
Reporter Professional Plus is now compatible with 32 & 64 bit editions of Windows 7, Windows 8/8.1 and Windows 10.
Updated User Interface New
The user interface has been given a major update and now has a fresh new look. A Help feature has been added to all major menus.
Help and Manual New
For the first time a fully context sensitive, hyper-linked, help file is included. This is also available, in full, online.
You can view the manual here : Reporter Professional Plus Manual
Unified Colours New
One of the most requested features we have been asked for is the option to use the new unified colour scheme. There is now the option for all charts and reports to use the new "Unified Colours" or the original "Classic Colours". Although we believe the "old" colours look better, you are now free to make your choice! Either way the phases are now referred to in the standard form L1, L2, L3.
Communication Port Selection Improved
A common issue with earlier versions was that some USB to Serial devices would assign a ridiculously high port number to the serial port, leaving it out of range of the previously adequate 1-8 range. Now only the ports recognised by Windows are listed, making finding the correct port (whatever the number) far easier.
Auto Reporting Improved
The "Auto Reporting" feature can now create a single PDF file with any/all reports included, making emailing of your results a much easier affair.
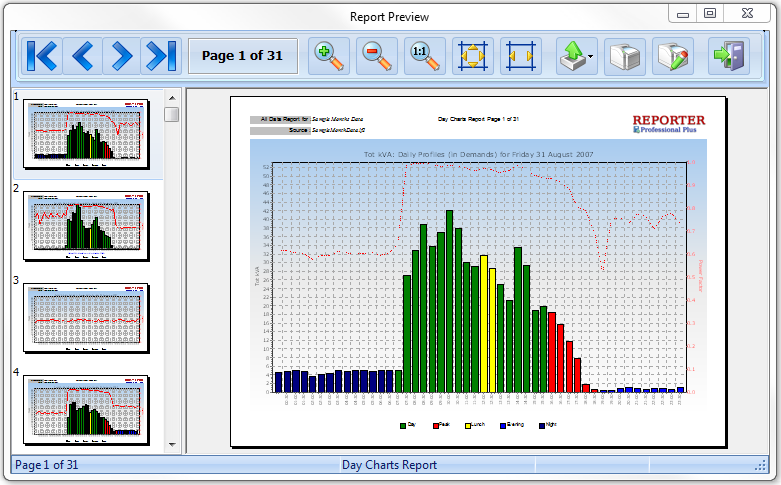
PDF Chart Reports New
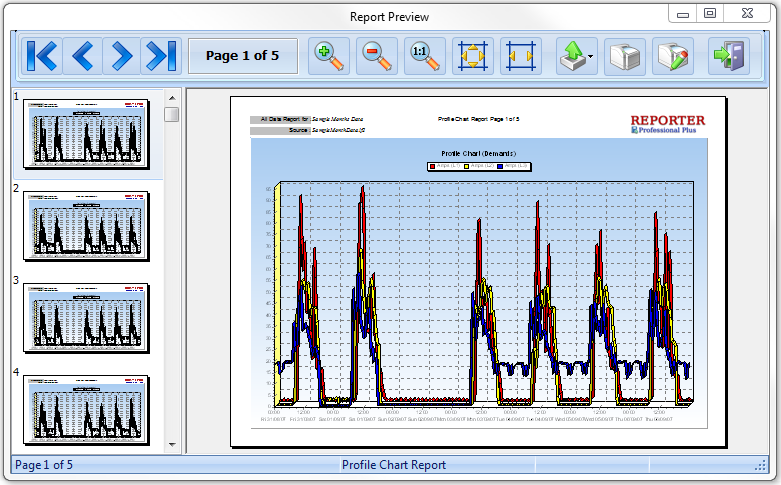
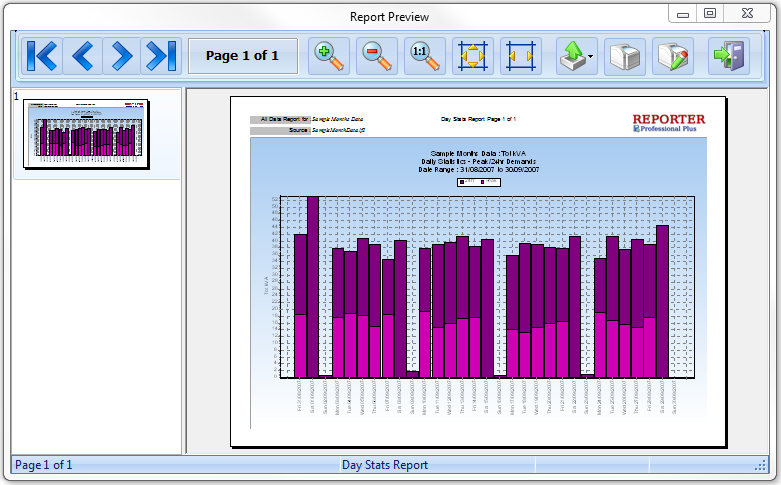
Another frequent request has been the option to produce PDF files from charts . We have gone one step further and added the ability to produce a complete report from any one of several different charts, such as the Daily Data chart, shown below in report form ...
Updated Spectrum Analysis Improved
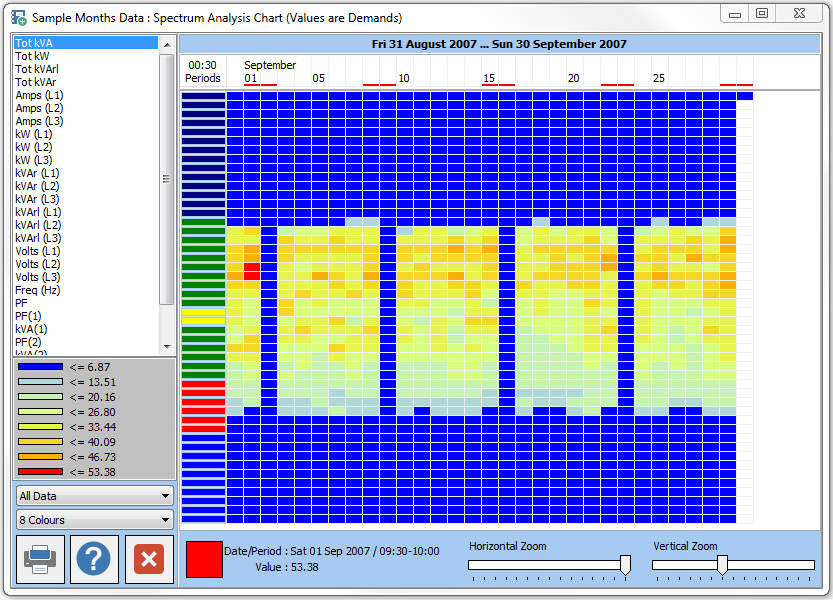
The example below illustrates the effect of the occupied period of this building on kVA and Power Factor. Any missing blue zones on the kVA display mean something was left on!
Updated Real-time Monitor Improved
For compatible loggers you can now use the updated real-time view ...


