
Eco Warrior Tools
Eco Warrior Tools is our offline data analysis and energy audit system. Whether you have one site or hundreds Eco Warrior Tools can give you detailed energy performance analysis that is easy to understand and clear to see.
The data can be provided by our Eco Warrior Pro software or come form one of our Eco Warrior Guardian products, which can collect data from your supplier's website, or by other means.
A detailed and comprehensive costing system allows invoices to be generated for tenants or cost centres, meaning you can create utility bills in-house - often weeks before the real ones arrive!
Targets can be created and applied to each channel, either based on historical data which can be adjusted by percentage or value, or you can create the targets "from scratch". Different targets can be set by day and/or month to provide accurate season monitoring and targeting.
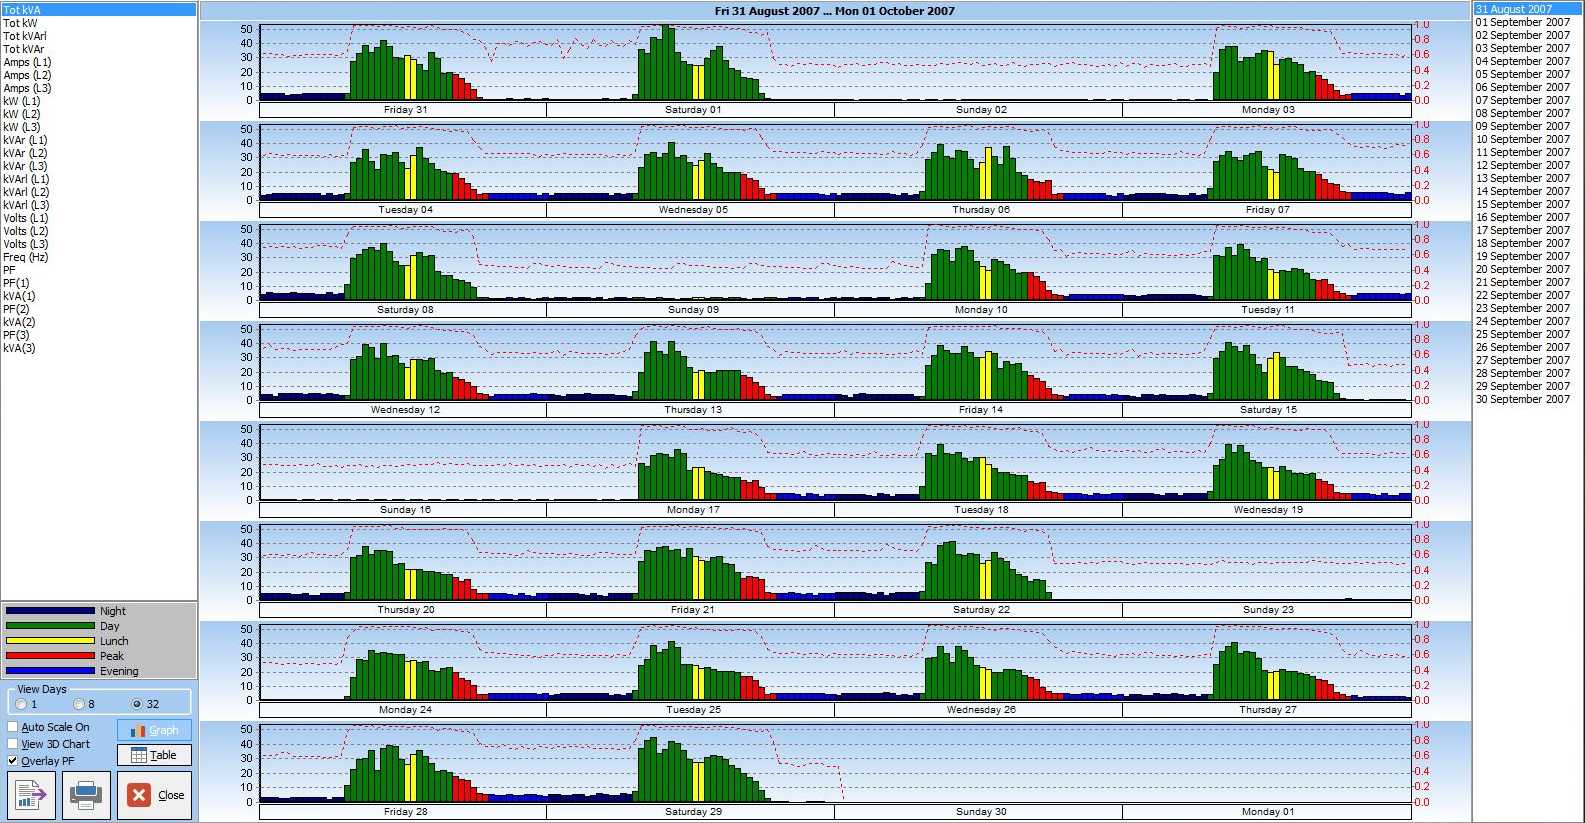
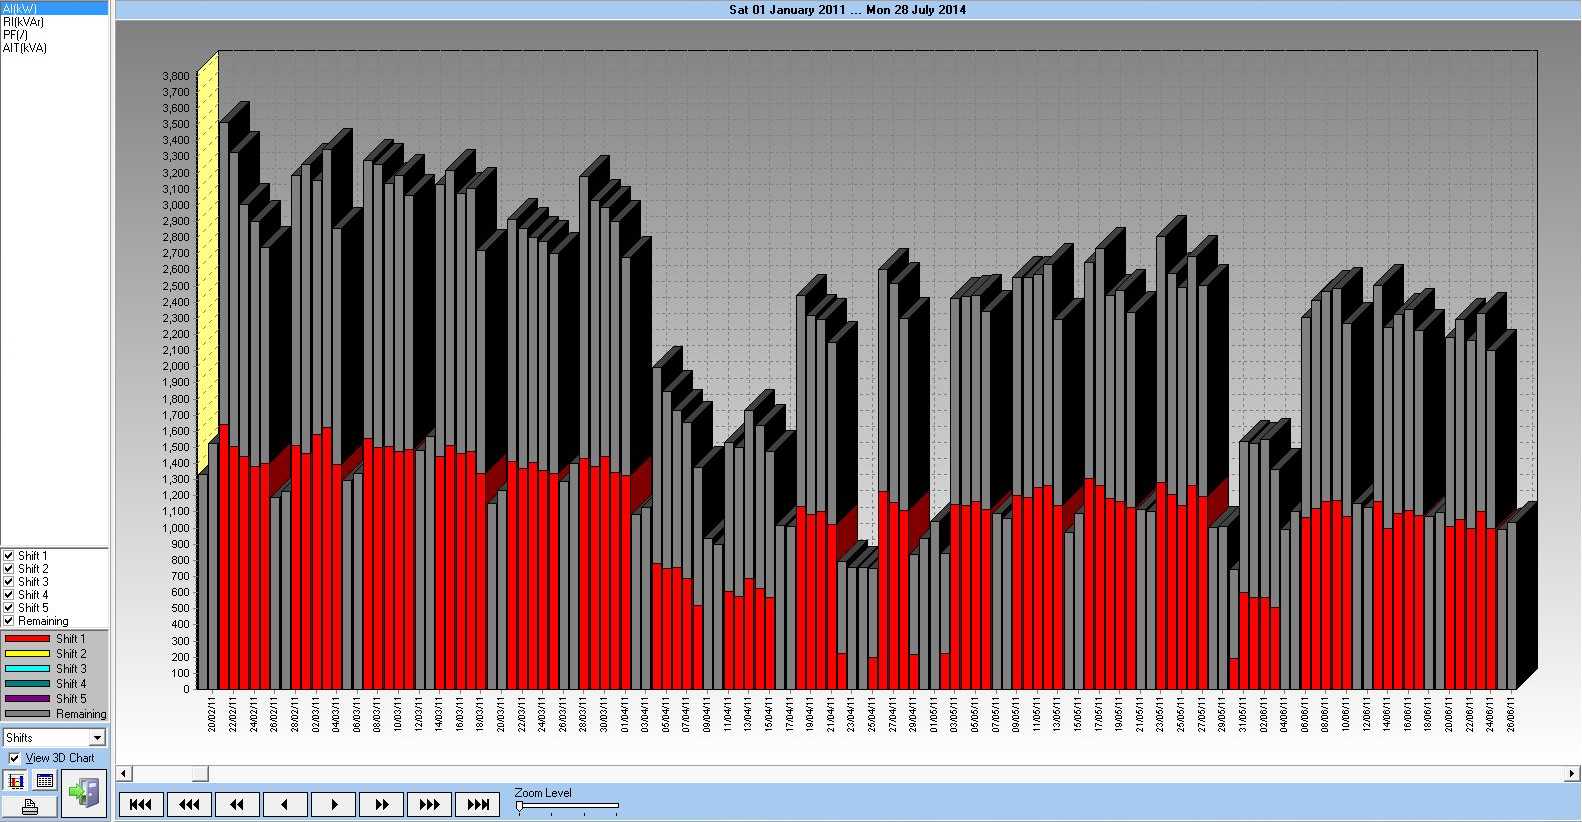
Energy data can be viewed as profiles or text, from half hourly values to multiple years. This page shows just a few examples of how data can be viewed and analysed using Eco Warrior Tools but there are many more.
Some features are ...
- Easy to use high quality charts.
- Reports and Charts for Daily, Weekly, Monthly and Annual energy usage.
- Tariff Analysis, Bill Checking, Tenant Billing and Cost Centre Analysis.
- Cusum Charts.
- League Tables for Multiple Sites (such as kWh/m²).
- Degree Day Analysis.
- Linear Regression Analysis.
- Automated Profile and Target Checking.


Spectrum analysis provides a clear view of energy waste during known non-operational periods and allows you to identify problem and costly high demand periods. Columns represent days and rows are half hour periods of the day. Each cell is colour coded to represent the energy used during that period. Red represents high consumption, with the shade being proportional to the energy used. Blue is used for the lowest or zero consumption.
This example shows a site before and after Eco Warrior Pro was used to identify waste. The before image clearly shows water being used all day and night. The after image shows consumption is greatly reduced, with small islands representing the use of water from 8am till 5pm and very little, if any, use during the night, early mornings and weekends.
