mydata
NewYour energy data, online, from anywhere
mydata is our new browser-based viewer for your energy data — no software to install, just log in and see how your sites are performing. It works equally well with sites on real-time monitoring or purely Automated Meter Reading (AMR) data from your supplier — even a mix of both across your portfolio — giving you a lightweight way to check in on totals, demands and out-of-hours waste from any device.
We're still actively rolling this out and adding sites, so it isn't a fully self-service product yet — but if you'd like early access, or want to see it in action, we'd love to show you.
See it in action
Real data from a live site, with identifying details removed.
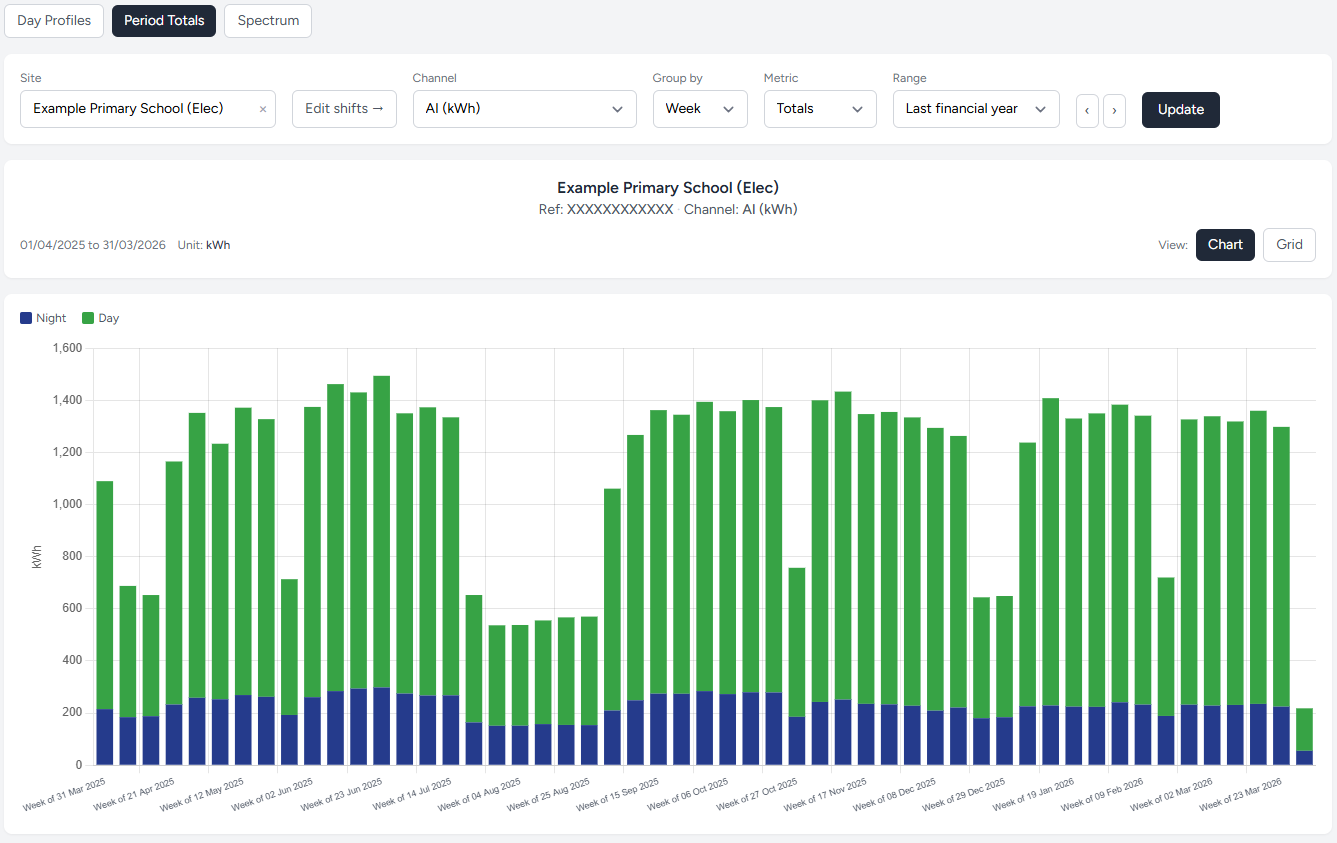
Weekly totals split into Night and Day usage, straight from a browser.
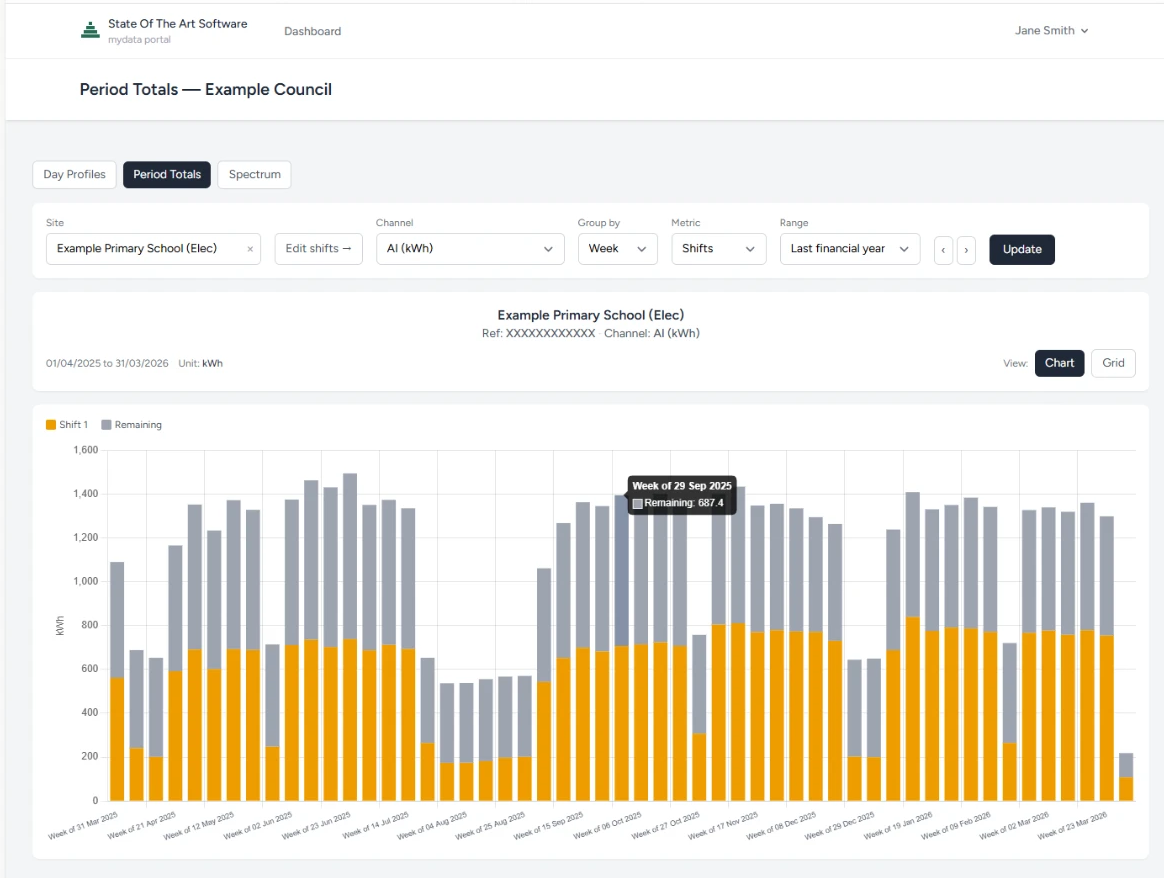
Shift-based reporting shows exactly how much is being used outside opening hours.
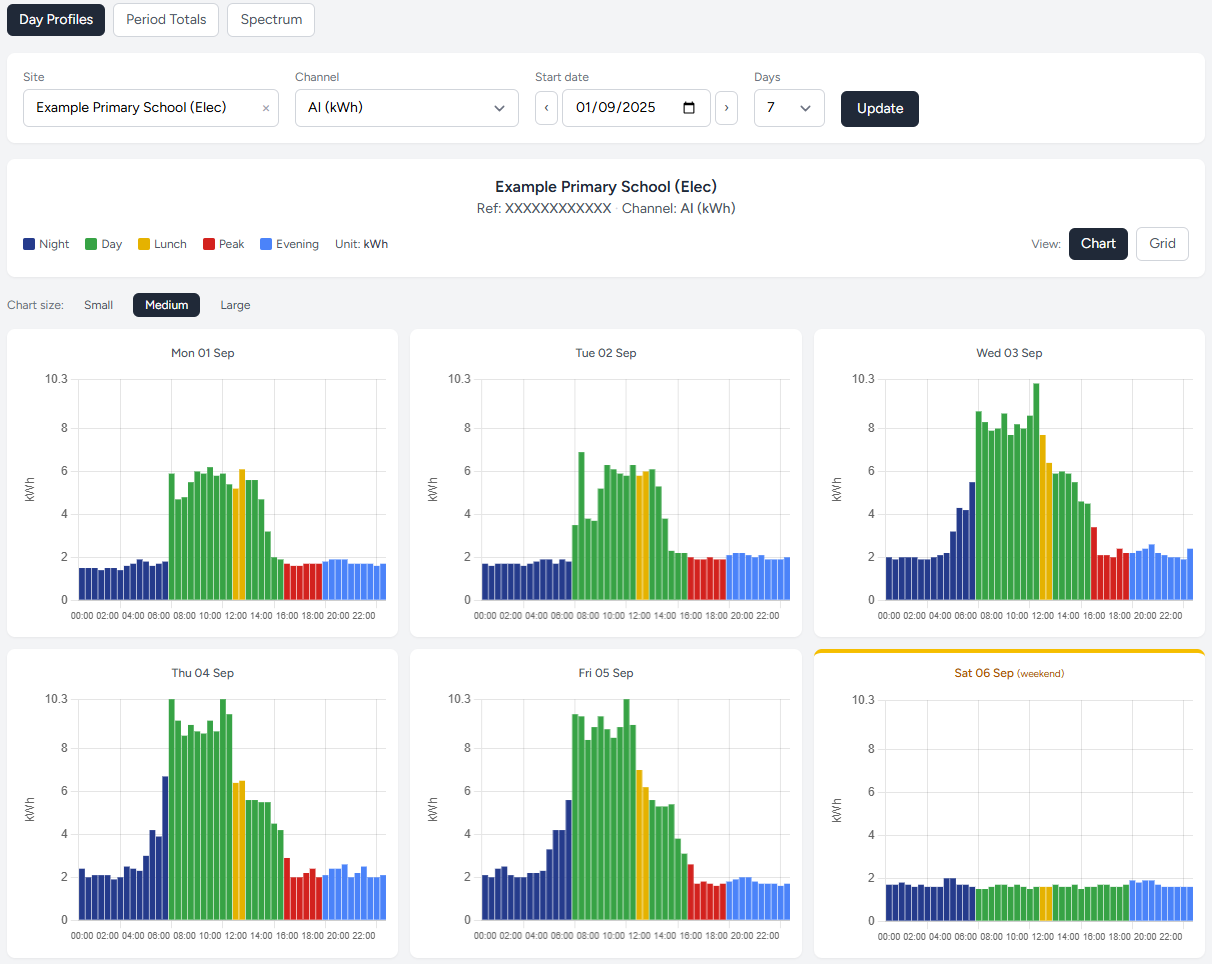
Day profiles broken down by Night, Day, Lunch, Peak and Evening bands.
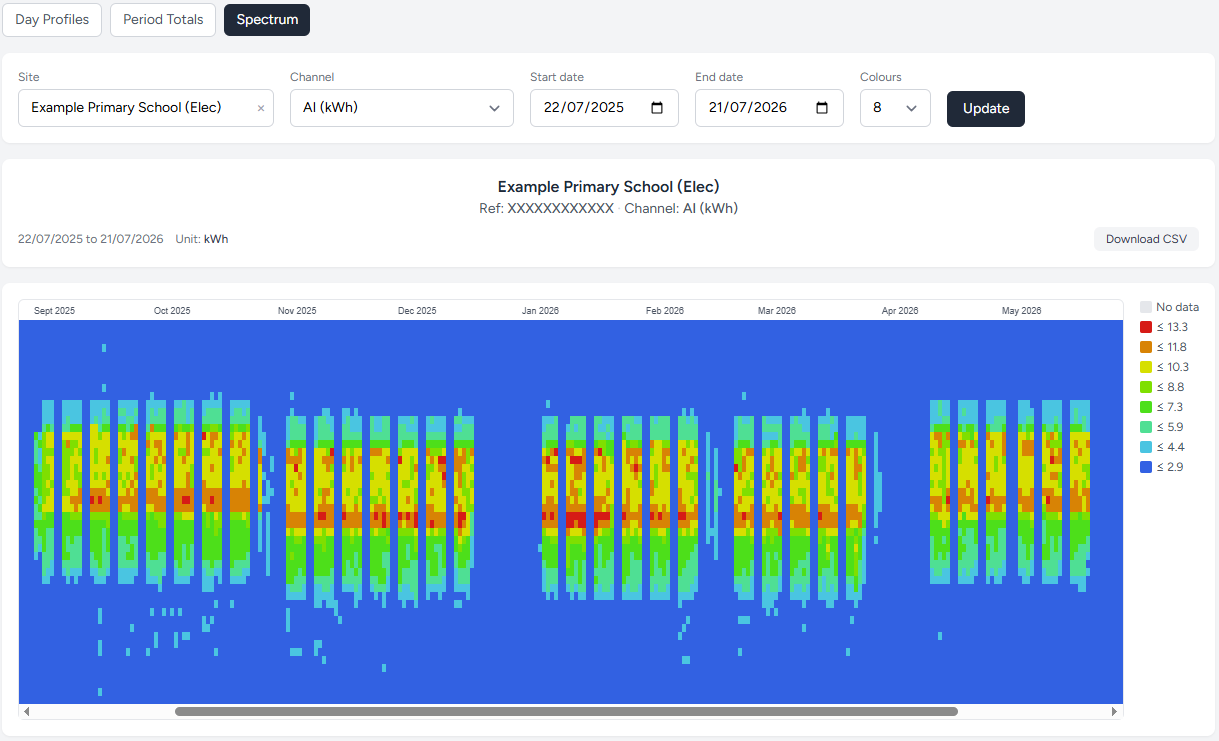
A full year at a glance — spectrum view makes occupancy patterns and holidays easy to spot.
Nothing to install
Runs entirely in your browser. Log in from a laptop, tablet or phone, on-site or anywhere else.
All your sites, one place
See every site your company monitors from a single secure login — no juggling separate installs per site.
Works with AMR too
Not limited to real-time-monitored sites — mydata can show Automated Meter Reading (AMR) data from your supplier just as well, or a mix of AMR and real-time sites side by side.
Totals, demands & shifts
View period totals, demand profiles, and a shift-based breakdown of energy used during opening hours versus out-of-hours waste.
Built on real data
Reads from the same underlying data our desktop products collect, so it stays consistent with the numbers you already trust.