Eco Warrior Viewer
Real-time remote viewer for Eco Warrior Pro
Eco Warrior Viewer acts as a remote viewer for Eco Warrior Pro data in true real-time. Data for any circuit can be viewed in a variety of ways, including charts, tables, gauges and statistics. Multiple circuits can be displayed in different ways at the same time.
Values can be seen as units, demands, costs or compared against targets. You can also view your data as days, weeks, months or quarters, and compare against historical data — including as a cumulative total. Each user can see their own preferred data, in their own customised way.
Ways to view your data

Charts — real-time and historical profile charts for any circuit.
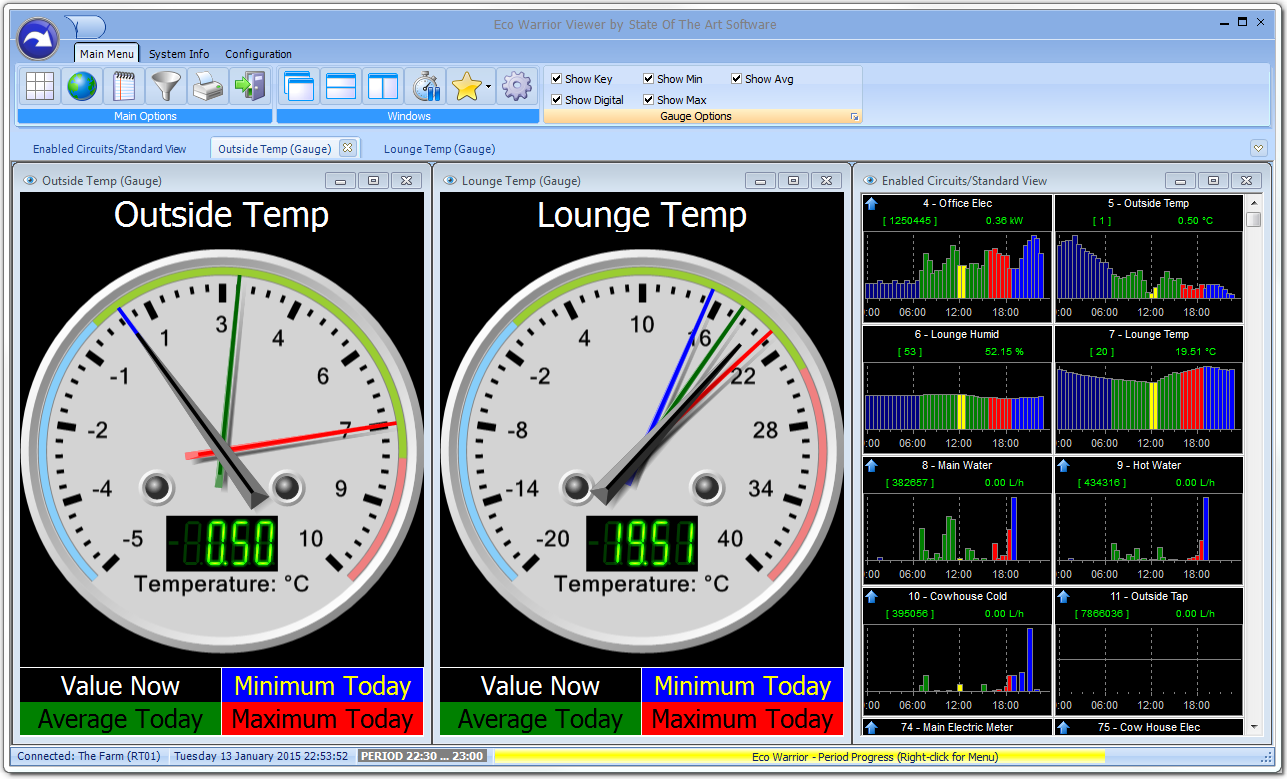
Gauges — at-a-glance dial views, ideal for wall-mounted displays.

Statistics — summary stats across multiple selected channels at once.

Multiple custom views of real-time and history, side by side.